Best Time to Visit Nha Trang: Rainfall and Temperature by Month
The national construction standard puts Nha Trang's wettest months at October and November, with averages of 312.3 and 381.6 mm. February is driest at 16.1 mm. Mean temperature stays between 24.0 and 28.8 degrees C all year. Storm landfalls on this coast bunch in October and November.
On this page
- Averages by month
- Month by month in short
- How much rain falls in the wet months
- The dry months
- Heat and humidity
- Wind and sea in the cool months
- Storms and the flood season
- A recent year against the averages
- Outlook for the end of the year and a flood reminder
- Peak season, crowds and events
- Which month for what
- Before you go
- Common questions
Nha Trang does not have a sunny half and a rainy half. It has a long dry stretch, a wet autumn and a short, windy winter. The national construction standard QCVN 02:2022/BXD prints long-term monthly averages for the Nha Trang weather station, and they put the heavy rain in September to December.
October and November are the extremes, at 312.3 and 381.6 mm of average rainfall. February is the opposite, at 16.1 mm. Temperature barely moves by comparison, with monthly means between 24.0 and 28.8 degrees C.
This guide uses three layers of evidence. The first is the long-term average table from the standard. The second is the 2024 yearbook of the National Statistics Office, which shows what one actual year looked like. The third is the official seasonal outlook issued by NCHMF on 15/9/2026.
Averages by month
The table below joins five of the standard’s tables for the Nha Trang station. Each figure is a long-term average, not a forecast.
| Month | Mean temperature (degrees C) | Rainfall (mm) | Rainy days | Sunshine (hours) |
|---|---|---|---|---|
| January | 24.0 | 43.0 | 8.6 | 179.6 |
| February | 24.6 | 16.1 | 4.3 | 208.7 |
| March | 25.8 | 30.3 | 4.1 | 256.5 |
| April | 27.4 | 41.8 | 5.0 | 258.5 |
| May | 28.6 | 81.7 | 9.2 | 259.1 |
| June | 28.8 | 49.8 | 8.3 | 235.2 |
| July | 28.5 | 41.7 | 8.4 | 243.5 |
| August | 28.5 | 51.5 | 9.8 | 236.0 |
| September | 27.8 | 165.8 | 14.4 | 203.8 |
| October | 26.7 | 312.3 | 17.6 | 183.1 |
| November | 25.8 | 381.6 | 18.0 | 140.4 |
| December | 24.7 | 191.4 | 14.4 | 136.5 |
| Year | 26.8 | 1,399.2 | 122.2 | 2,538.8 |
A few readings stand out. Rainfall jumps from 51.5 mm in August to 165.8 mm in September. November has the most rainy days, at 18.0, and December has the least sunshine, at 136.5 hours. May has the most sunshine, at 259.1 hours.
Month by month in short

- January: 43.0 mm of rain over 8.6 rainy days, a mean of 24.0 degrees C and wind averaging 3.3 m/s. The 2024 reading for the month was 45.5 mm.
- February: the driest month on average, at 16.1 mm over 4.3 rainy days. Sunshine averages 208.7 hours.
- March: 30.3 mm over 4.1 rainy days, the fewest of any month. Sunshine climbs to 256.5 hours. March 2024 was drier still, at 2.9 mm.
- April: 41.8 mm over 5.0 rainy days, with 258.5 hours of sun and a mean of 27.4 degrees C.
- May: rainfall rises to 81.7 mm and rainy days to 9.2, with thunderstorms on 4.2 days on average. It is also the sunniest month at 259.1 hours.
- June: 49.8 mm over 8.3 rainy days. It is the warmest month on average, at 28.8 degrees C, with the lowest wind of the year at 1.5 m/s.
- July: 41.7 mm over 8.4 rainy days, a mean of 28.5 degrees C and 243.5 hours of sun.
- August: 51.5 mm over 9.8 rainy days and 236.0 hours of sun.
- September: the turn. Rainfall averages 165.8 mm over 14.4 rainy days, with 5.4 thunderstorm days.
- October: 312.3 mm over 17.6 rainy days, with sunshine down to 183.1 hours.
- November: the wettest month, at 381.6 mm over 18.0 rainy days, with 140.4 hours of sun.
- December: 191.4 mm over 14.4 rainy days, the least sun at 136.5 hours and the strongest average wind at 4.0 m/s.
How much rain falls in the wet months

The long-term average for a whole year is 1,399.2 mm. October and November are the two wettest months, at 312.3 and 381.6 mm. September and December sit at 165.8 and 191.4 mm.
Averages hide the worst single days. The standard also prints the largest daily rainfall recorded for each month. In October that figure is 364.0 mm, in December 348.7 mm and in November 334.1 mm.
Vietnam’s forecasters call rain heavy at over 50 mm in 24 hours and very heavy at over 100 mm in 24 hours. By that definition the largest daily falls in the table are very heavy in most months. Even February’s largest day, at 72.2 mm, passes the 50 mm line.
The dry months can still deliver a single big day. January’s largest daily rainfall is 227.0 mm and March’s is 241.1 mm. April’s is 102.4 mm.
The dry months

On the averages, the driest run is February to April. Rainfall is 16.1, 30.3 and 41.8 mm in those months, with 4.3, 4.1 and 5.0 rainy days. Sunshine builds from 208.7 to 258.5 hours across the same months.
June and July are also dry by Nha Trang’s standards, at 49.8 and 41.7 mm. The difference is heat and wind. Those months have the highest mean temperatures and the lowest wind speeds of the year.
The 2024 yearbook supports the dry-spring pattern for one year. March 2024 recorded 2.9 mm and February 2024 recorded 16.8 mm. June, August and July of 2024 recorded 26.9, 32.9 and 56.7 mm.
Heat and humidity

Nha Trang’s average temperature range is narrow. The coolest month averages 24.0 degrees C (January) and the warmest 28.8 degrees C (June). The year averages 26.8 degrees C.
Daytime highs run hotter. The mean daily maximum is 32.3 degrees C in May, 32.7 in June and 32.6 in August, and 30.3 over the year. The mean daily minimum stays between 21.4 and 25.7 degrees C.
The record highs printed for the station are 37.5 in May, 37.8 in June and 37.9 in both July and August. Vietnam’s disaster rules call a day a hot spell when the highest temperature passes 35 degrees C. The table’s record highs pass that line from May to September.
Humidity averages 79.3 percent for the year. It is lowest in July at 76.9 percent and highest in October at 82.6 percent.
Wind and sea in the cool months
Mean wind speed at the station is 1.5 m/s in June and rises to 3.4 m/s in November and 4.0 m/s in December. January is 3.3 m/s. The calm months are April to September, at 2.3 m/s or less.
NCHMF’s seasonal bulletin explains the sea side of this. It says storms, tropical depressions and the northeast monsoon cause strong winds and big waves that affect activities on the East Sea.
The practical reading is that boat days are least exposed to wind from April to September on the averages, and most exposed from November to January. Check the same-day forecast before any island trip.
Storms and the flood season
Storms reach this coast mostly in October and November. The national standard’s landfall table for the coastal stretch from Binh Dinh to Ninh Thuan prints monthly frequencies of 0.39 for October and 0.40 for November. September is 0.04 and December is 0.07. January, February, May, July and the other low months print 0.00 to 0.04.
The same standard covers landfalls from 1961 to 2017. Its list for that coastal stretch includes Cimaron, which came ashore on 26/10/2006 at force 13.
Decision 18/2021/QĐ-TTg sets the flood season on rivers from Quang Binh to Ninh Thuan at 1 September to 15 December. That window matches the rainfall table, where September to December is the wet run.
The forecast for the end of 2026 points lower. NCHMF’s bulletin issued on 15/9/2026 expects fewer storms and tropical depressions affecting Vietnam from October to December 2026. The average on the East Sea is 4.5, with 1.9 making landfall. For risk levels and bulletin schedules, see Nha Trang rainy season and storms.
A recent year against the averages
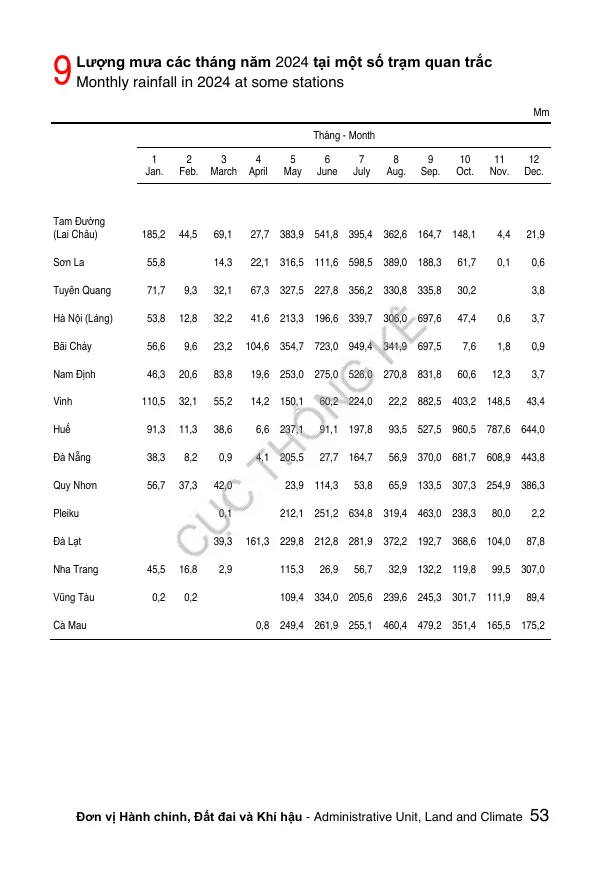
The 2024 yearbook gives one real year to compare with the table. Its Nha Trang monthly rainfall for 2024 reads 45.5, 16.8, 2.9, blank for April, 115.3, 26.9, 56.7, 32.9, 132.2, 119.8, 99.5 and 307.0 mm. The monthly mean temperature reads from 25.3 to 30.2 degrees C.
| Month (2024) | Rainfall (mm) | Mean air temperature (degrees C) |
|---|---|---|
| January | 45.5 | 25.3 |
| February | 16.8 | 26.0 |
| March | 2.9 | 27.2 |
| April | Not printed | 29.3 |
| May | 115.3 | 30.2 |
| June | 26.9 | 29.8 |
| July | 56.7 | 29.0 |
| August | 32.9 | 29.6 |
| September | 132.2 | 28.8 |
| October | 119.8 | 27.9 |
| November | 99.5 | 26.9 |
| December | 307.0 | 25.3 |
In 2024 the wet season came late and hit December hardest. December’s 307.0 mm was well above the 191.4 mm average, while October’s 119.8 mm and November’s 99.5 mm fell far below the 312.3 and 381.6 mm averages. The year’s total was 955.5 mm against an average of 1,399.2 mm.
Annual totals swing widely. The yearbook prints 1,225.8, 1,917.7, 1,789.7, 1,242.3 and 955.5 mm, oldest to newest.
Temperature ran warm. Every 2024 monthly mean was above the long-term mean for the same month, for example 30.2 against 28.6 degrees C in May and 25.3 against 24.0 in January.
The yearbook’s sunshine row reads 304.7 hours in August 2024 and 130.2 in November 2024, and prints December as 19.1. For December, use the long-term average table above instead.
Outlook for the end of the year and a flood reminder

NCHMF issued its seasonal bulletin at 15h00 on 15/9/2026. For the next months it says:
- October 2026: total rainfall 20-40% below the long-term average from Quang Tri to Hue, the South Central Coast and the Central Highlands. Moderate and heavy rain may still occur across the country.
- November 2026: rainfall from Quang Tri to Lam Dong generally 20-40% below average.
- December 2026: rainfall in the South Central Coast 50-100 mm below average, although moderate to heavy rain may still occur in Khanh Hoa.
- October to December 2026: storms and tropical depressions likely below average.
- Season change: thunderstorms, tornadoes, lightning and hail may occur nationwide.
The bulletin ties part of this to El Nino. It puts the ocean temperature anomaly at 2.0 degrees in the second week of September 2026, at the threshold of very strong intensity.
A dry forecast is not a safe one. A heavy rain and flood event hit Khanh Hoa in November 2025. The province’s quick report counted 14 deaths, 15,396 houses flooded 1 to 3 m deep and over 13,300 ha of rice, crops and fruit trees damaged. On the morning of 20/11 the water reached its highest level on record as reservoirs released water together.
Tourists were caught too. Three Russian nationals were rescued in Nha Trang on 18/11/2025. Tay Nha Trang Ward reported water up to two meters in places. Authorities evacuated 3,200 households, about 13,000 people.
Storm Kalmaegi earlier that month showed how tours react. From 10h on 5/11, tourist boats were banned from leaving port for Vinh Hy bay.
Peak season, crowds and events

Operators and news reports describe the visitor calendar differently from the weather tables. VinWonders, an attraction operator, calls January to August the peak season and September to December the low season. It says February to April is ideal and March, April or September suit travellers avoiding crowds.
That page is marketing, so test it against the data. It describes the October to December rainy season as mostly light, sudden rain with little storm impact. The averages above show 17.6 and 18.0 rainy days in October and November, and the landfall table peaks in those same two months.
The same page does name a real saving. It says flight, room and service prices are lower in the rainy season. No official price series is confirmed for these months.
Summer is the other busy window. A 5/5/2026 Tuoi Tre item says Nha Trang-Khanh Hoa tourism was entering its summer peak after the 30/4 and 1/5 holiday, with many large events.
The Sea Festival has been a June event: the 2025 version was announced for 10/4 to 27/6, peaking from 7 to 9 June. Khanh Hoa then replaced it with a smaller Sea Culture-Tourism Festival. On the opening night of the 2023 festival, central streets were jammed for hours.
The Ponagar Tower festival runs from the 20th to the 23rd of the 3rd lunar month, which usually falls in April or May.
Lunar New Year 2027 needs early planning. The Ministry of Home Affairs proposed that civil servants rest from 4/2/2027 to 10/2/2027, pending the Prime Minister’s decision.
Which month for what

| Goal | Months the numbers favour | Why |
|---|---|---|
| Least rain | February and March | 16.1 and 30.3 mm, with 4.3 and 4.1 rainy days |
| Most sun | March to May | 256.5, 258.5 and 259.1 hours |
| Calmest wind | May to September | 1.9 m/s or less in each of those months |
| Coolest air | December to February | 24.7, 24.0 and 24.6 degrees C |
| Lowest storm risk | January to September | landfall frequency 0.00 to 0.04 |
| Most rain and storm risk | October and November | 312.3 and 381.6 mm, and 0.39 and 0.40 |
No single month wins every column. February and March are driest, but the cool air and the stronger average wind of those months differ from the calm, hot run of June to August. April to May balance sun and low rain, but May’s rainfall rises to 81.7 mm and its record high reaches 37.5 degrees C.
Before you go

- Check NCHMF’s Nha Trang station page on the day. On 12/10/2026 at 16h it showed 30 degrees C, cloudy, no rain.
- Treat the outlook as provisional. A newer NCHMF seasonal bulletin can replace the one issued on 15/9/2026.
- Plan for a big single day in any month. Heavy rain means over 50 mm in 24 hours, and the largest daily falls in the table exceed that in every month.
- Expect strong sun from March to September. Mean daily maximums run at 29.4 degrees C or more in those months, and sunshine runs from 203.8 to 259.1 hours.
- Allow flexible days from October to December. Those months have the most rainy days and the highest landfall frequency.
For getting around in wet weather, see getting around Nha Trang and Cam Ranh Airport to Nha Trang. For the storm side of the picture, see Nha Trang rainy season and storms. For things to do by weather, see island hopping, diving and snorkelling, the Oceanography Museum and the mud baths.
Photos and clips uploaded to Google Maps (Nha Trang Beach on Google Maps (opens in a new tab)) by @Khoa Trần, @B.H.T., @Hai Nguyen, @Tony Nguyen, @Tâm Nguyễn Văn, @Hoai Anh Nguyen, @Pham Hoang Cao Son, @CNA CHÂU.
Not confirmed: The years behind the long-term averages are not printed in the rows used, and whether the yearbook figures come from the same station is not confirmed. April 2024 rainfall is blank and December 2024 sunshine reads 19.1 hours in the printed table. Room prices by month are not confirmed from an official source.
Common questions
Which month is wettest in Nha Trang?
November, with an average of 381.6 mm at the Nha Trang station, ahead of October at 312.3 mm.
Which month is driest in Nha Trang?
February, with an average of 16.1 mm over 4.3 rainy days.
How hot does Nha Trang get?
The monthly mean runs from 24.0 degrees C in January to 28.8 in June, and the record high printed for the station is 37.9.
When do storms usually reach Nha Trang?
Landfall frequency on the Binh Dinh to Ninh Thuan coast peaks at 0.39 in October and 0.40 in November.
When is the flood season in this part of Vietnam?
Decision 18/2021/QĐ-TTg sets it from 1 September to 15 December on rivers from Quang Binh to Ninh Thuan.
Is the rainy season light and short?
The averages show 17.6 rainy days in October and 18.0 in November, and heavy floods hit Khanh Hoa in November 2025.
Is 2024 a typical year for rain?
Annual totals in the yearbook table range from 955.5 mm to 1,917.7 mm, so one year is not a guide.
What does the forecast say for late 2026?
NCHMF's bulletin issued on 15/9/2026 expects fewer storms than average from October to December 2026.
Can it still rain heavily in December 2026?
NCHMF says moderate to heavy rain may still occur in Khanh Hoa in December 2026.
When is the Nha Trang summer peak season?
A May 2026 news report says Nha Trang-Khanh Hoa tourism was entering its summer peak after the 30/4 and 1/5 holiday.
Read next
General information checked against the sources listed above, not legal advice for your situation. Rules and office practice change; confirm with the immigration office or a licensed adviser before you act. See how guides are checked.
Spotted an error? Report it.